Crop coefficients and FAO-56: scheduling irrigation from evapotranspiration
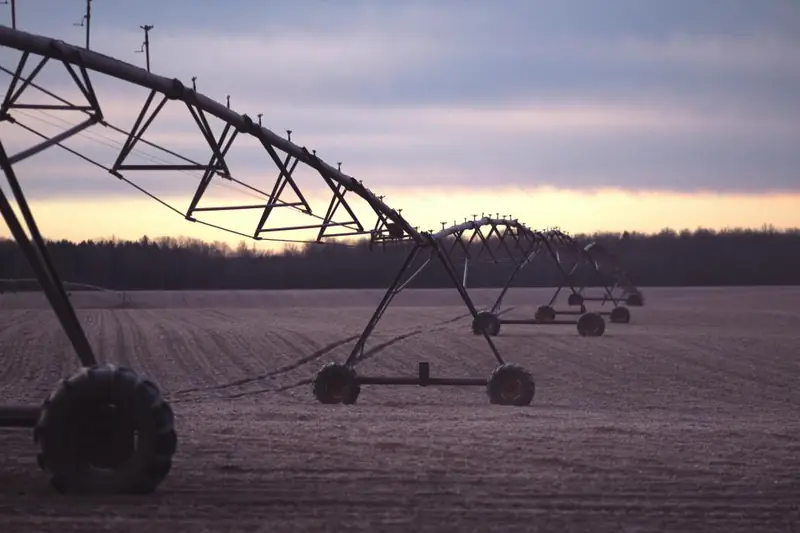
Photo: stocksnap (CC0, credits)
Most irrigation advice services, from a regional bulletin to a commercial scheduling app, rest on the same method: FAO Irrigation and Drainage Paper 56, published in 1998. It estimates how much water a crop uses from weather data and a table of crop coefficients. Knowing how it works helps judge what a recommendation is worth.
Step one: the reference crop
FAO-56 separates the weather from the crop. It first computes a reference evapotranspiration (ETo): the water used by a hypothetical, well-watered grass surface 0.12 m tall, with a fixed surface resistance of 70 s/m and an albedo of 0.23. ETo depends only on the weather, so one station can serve every field around it.
The standard formula is the FAO Penman-Monteith equation. It needs daily solar radiation (or sunshine hours), maximum and minimum air temperature, air humidity and wind speed measured at 2 m. These are exactly the variables a farm or regional weather station records, which is why stations such as those the FIGARO pilots used deliver ETo as a daily value (see sensors and satellite images in precision irrigation).
When only temperature is available, FAO-56 accepts the Hargreaves equation, which estimates ETo from mean temperature, the daily temperature range and extraterrestrial radiation. It is a fallback: the paper recommends checking it against Penman-Monteith values in the same region before relying on it.
Step two: the crop coefficient
A crop differs from reference grass in height, leaf area, rooting and how much bare soil it leaves exposed. FAO-56 captures this in a crop coefficient (Kc), and crop evapotranspiration is simply:
ETc = Kc × ETo
Kc changes over the season. The paper divides it into four stages: initial (sowing to about 10% ground cover), crop development, mid-season (full cover) and late season (to harvest or senescence). It tabulates three values per crop: Kc ini, Kc mid and Kc end. For grain maize, for instance, the table gives about 0.3 at the start, 1.20 at mid-season and falling values at the end; for tomato, 0.6, 1.15 and 0.7–0.9.
| Stage | What happens | Kc behaviour |
|---|---|---|
| Initial | Mostly bare soil, small plants | Low; depends heavily on how often the soil surface is wetted |
| Development | Canopy closes | Rises roughly linearly |
| Mid-season | Full cover, flowering, fruit or grain filling | Peak, often above 1 for tall crops |
| Late season | Ripening, senescence | Falls, steeply if the crop dries in the field |
The tabulated values assume a sub-humid climate (minimum relative humidity around 45%, wind around 2 m/s). FAO-56 gives a correction for drier, windier or more humid conditions: in an arid, windy climate a tall crop's mid-season Kc goes up. A dual coefficient version splits Kc into a basal crop part (Kcb) and a soil evaporation part (Ke). It is more work but better suited to drip irrigation and frequent wetting, where soil evaporation varies a lot from day to day.
Tree and vine crops need extra care. Their coefficients depend less on the calendar than on how much of the ground the canopy shades, on pruning and on whether the inter-row is bare or grassed. FAO-56 gives values for mature orchards with and without ground cover, and a method to adjust them for young trees with partial cover. A newly planted orchard uses far less water than the same trees at maturity, so a mature-orchard value applied blindly would overwater it.
Step three: the soil water balance
Knowing daily water use is not enough: the scheduler needs to know when the root zone will run short. FAO-56 keeps a daily account of root-zone depletion. Water comes in as effective rainfall and irrigation; it leaves as ETc, deep percolation and runoff.
- Total available water (TAW) is the water held between field capacity and wilting point over the rooting depth.
- Readily available water (RAW) is the fraction p of TAW the crop can extract without stress. The paper tabulates p by crop, with 0.5 a common value, and adjusts it for evaporative demand: on hot, high-demand days, stress starts earlier.
- Once depletion exceeds RAW, a water stress coefficient (Ks) below 1 reduces actual evapotranspiration, and usually yield.
A simple schedule follows: irrigate when depletion approaches RAW, and apply enough to bring the root zone back towards field capacity, divided by the application efficiency of the system. Deliberately letting depletion go beyond RAW at chosen stages is the basis of the strategies discussed in our analysis of regulated deficit irrigation.
Where the method goes wrong
Every number in this chain is an estimate. Tabulated Kc values describe a healthy, uniform, unstressed crop; a thin stand, a young orchard or a cover crop between rows will differ. Rooting depth and soil water-holding capacity vary inside a single field. Effective rainfall is hard to estimate in heavy storms. Small daily errors accumulate in the balance, and after a few weeks the computed depletion can be far from reality.
This is the drift problem the FIGARO partners described in their interviews on crop models (see keeping crop models in step with the field). The remedy is the same whatever the model: correct the calculation with measurements. Soil moisture probes reset the balance; meters record what was actually applied; canopy sensors or satellite vegetation indices adjust Kc to the real crop cover. FAO-56 provides the structure; field data keep it honest.
What to ask of a scheduling service
- Which ETo equation does it use, and from which station? A station far away, or over irrigated ground, changes the numbers.
- Are Kc values taken straight from the tables, or adjusted for local climate and actual crop cover?
- Does it use measured irrigation and rainfall, or planned ones?
- Can soil moisture readings correct the balance during the season?
Sources
- Allen R. G., Pereira L. S., Raes D., Smith M. (1998), Crop evapotranspiration: guidelines for computing crop water requirements, FAO Irrigation and Drainage Paper 56, Rome.
- Hargreaves G. H., Samani Z. A. (1985), “Reference crop evapotranspiration from temperature”, Applied Engineering in Agriculture 1(2): 96–99.
- Pereira L. S. et al. (2021), “Standard single and basal crop coefficients for field crops. Updates and advances to the FAO56 crop water requirements method”, Agricultural Water Management 243.