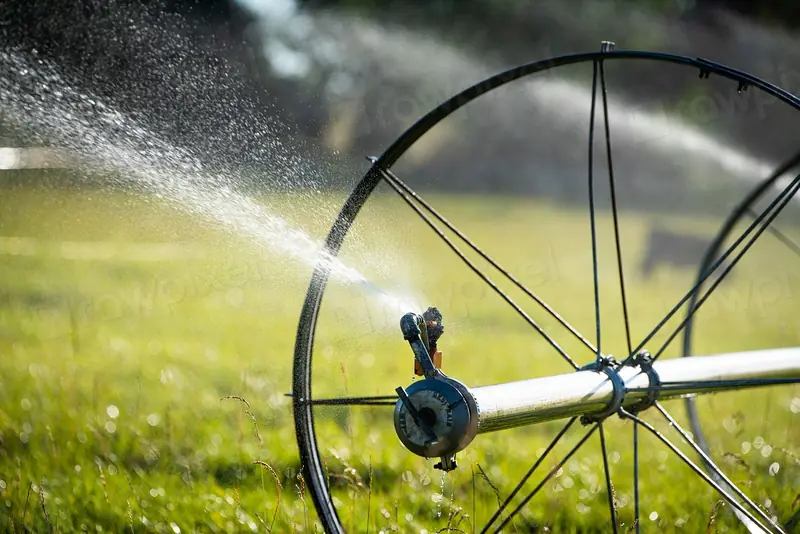
Drip irrigation uniformity: checking that every plant gets the same water
Photo: rawpixel (CC0, credits)
A scheduling tool can calculate to the millimetre how much water a crop needs. The figure is only useful if the irrigation system then delivers that amount to every plant. In practice no system is perfectly even: some emitters run fast, others slow or clogged, and the end of a long lateral rarely sees the pressure of its inlet. Uniformity is the measure of that unevenness, and it is the first thing an irrigation audit looks at.
Why uniformity comes before scheduling
An irrigator sets the run time so that the drier parts of a field get enough water. If one block of emitters delivers 20% less than the average, either those plants are under-watered, or the whole field is run longer to compensate and the rest receives more than it needs, with the surplus draining below the roots. Poor uniformity therefore costs water, energy for pumping and, through leaching, fertiliser.
It also undermines the precision tools themselves. A soil moisture probe reads the conditions around one or two emitters. If those emitters are representative, the probe speaks for the block; if they happen to sit in a fast or slow spot, every decision based on it is biased. The FIGARO partners made the same point about sensors in general (see sensors and satellite images in precision irrigation): a measurement is only as useful as the area it represents. Strategies that deliberately apply less water than the crop's full demand, such as regulated deficit irrigation, are even more sensitive, because the margin between a controlled deficit and real stress is narrow.
Three ways of putting a number on it
Irrigation engineers use several indicators. They measure related things and should not be compared with one another without care.
- Christiansen's coefficient of uniformity (CU), proposed in 1942 for sprinklers, compares each measured depth with the mean: CU = 100 × (1 − Σ|x − mean| / (n × mean)). A perfectly even system scores 100%.
- Low-quarter distribution uniformity (DU) divides the average of the lowest quarter of the measurements by the overall average. It focuses on the part of the field most likely to be under-watered, which is what matters when setting run times. For depths that follow a normal distribution, the two are linked approximately by DU ≈ 100 − 1.59 × (100 − CU).
- Emission uniformity (EU), developed by Keller and Karmeli in 1974 for drip and micro-irrigation, is used mainly at the design stage. It combines the ratio of minimum to average emitter flow, calculated from the pressure range across the system, with the manufacturer's coefficient of variation and the number of emitters per plant.
Burt and colleagues, in a widely cited 1997 paper, argued for consistent definitions: uniformity describes how evenly water is spread, irrigation efficiency describes how much of the applied water is used beneficially, and the two must not be confused. A system can be very uniform and still inefficient if it applies too much everywhere.
Measuring a drip system in the field
The classic field method, described by Merriam and Keller in their 1978 guide to farm irrigation system evaluation, samples emitters across the block in a regular pattern:
- Choose four laterals: one near the inlet of the manifold, one at the far end and two in between.
- On each lateral, pick emitters at the same four positions: near the inlet, at one-third, at two-thirds and at the far end. That gives sixteen sampling points.
- With the system at normal operating pressure, collect the water from each emitter in a container for a fixed time, a few minutes, and measure the volume. Convert to litres per hour.
- Record the pressure at the inlet and the far end of the sampled laterals with a gauge.
- Calculate the average flow, the average of the lowest quarter (the four lowest readings) and their ratio.
A worked example with illustrative readings: if the sixteen emitters average 2.0 L/h and the four lowest average 1.7 L/h, the low-quarter distribution uniformity is 1.7 / 2.0 = 85%. The pressure readings then tell the auditor where to look. A large pressure drop along the laterals points to a design or slope problem; similar pressures with scattered low flows point to clogging or worn emitters.
What makes a system drift
A new, well-designed drip system usually starts out uniform. Several things degrade it over the seasons.
| Cause | Typical sign | Usual remedy |
|---|---|---|
| Friction losses and elevation differences | Flow falls steadily along the lateral or uphill | Shorter laterals, larger pipe, pressure-compensating emitters, pressure regulators per block |
| Physical clogging (sand, silt) | Random emitters with very low flow | Better filtration, regular flushing of laterals and manifolds |
| Chemical clogging (calcium carbonate, iron) | Scale or rust-coloured deposits, gradual loss of flow | Water analysis, acid injection, managing the pH of fertigation |
| Biological clogging (algae, bacterial slime) | Slimy deposits, worse in warm weather or with surface water | Chlorination, covering storage, filtration |
| Manufacturing variation and wear | Spread of flows even at equal pressure | Emitter choice, replacement of worn drip line |
Pressure-compensating emitters keep their flow nearly constant over a stated pressure range, which makes them the standard answer on slopes and long runs. They do not cure clogging, and below their minimum operating pressure they behave like ordinary emitters, so the pressure at the end of the lateral still needs checking.
Uniformity and the water balance
Uniformity also enters the scheduling calculation directly. A method such as FAO-56 gives the net amount of water the root zone needs. The gross amount to apply is larger, to cover losses and unevenness. Many extension services divide the net requirement by the measured low-quarter distribution uniformity, so that the under-watered quarter still receives its share. With a DU of 85%, the gross application is about 18% higher than the net requirement; with a DU of 70%, it is about 43% higher. Improving uniformity is therefore often the cheapest water saving available, before any sensor or software is bought.
A short checklist
- Test each block at least once a season, and after any change of water source or fertigation programme.
- Keep the readings: a slow decline in average flow is the earliest sign of clogging.
- Check filters and flush laterals on a schedule, not only when a problem appears.
- Place soil moisture probes next to emitters whose flow is close to the block average.
- Use the measured DU, not a catalogue figure, when converting net into gross irrigation.
Sources
- Burt C. M., Clemmens A. J., Strelkoff T. S., Solomon K. H., Bliesner R. D., Hardy L. A., Howell T. A., Eisenhauer D. E. (1997), “Irrigation performance measures: efficiency and uniformity”, Journal of Irrigation and Drainage Engineering 123(6): 423–442, doi:10.1061/(ASCE)0733-9437(1997)123:6(423).
- Christiansen J. E. (1942), Irrigation by sprinkling, University of California Agricultural Experiment Station Bulletin 670, Berkeley.
- Keller J., Karmeli D. (1974), “Trickle irrigation design parameters”, Transactions of the ASAE 17(4): 678–684.
- Merriam J. L., Keller J. (1978), Farm irrigation system evaluation: a guide for management, Utah State University, Logan.