Energy for irrigation pumping: what a cubic metre costs in kilowatt-hours, and where to save
Photo: rawpixel (CC0, credits)
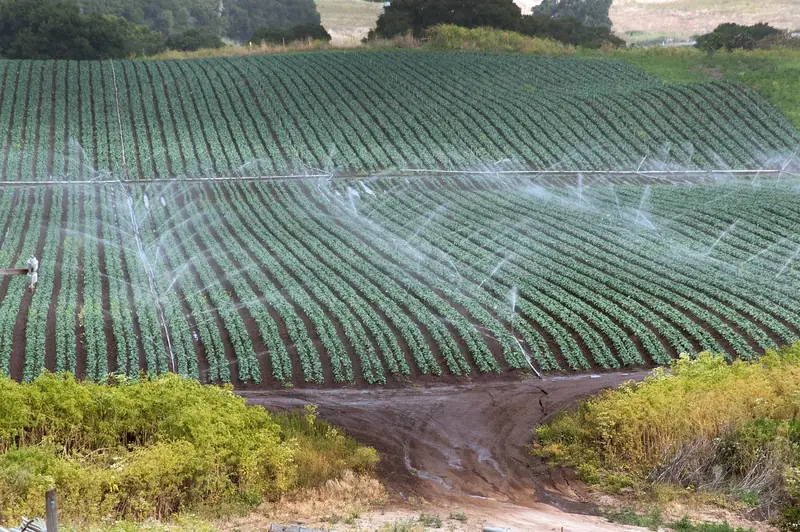
Precision irrigation is usually sold on water savings. Every cubic metre that reaches a field through a pipe has also been lifted, pushed and pressurised by a pump. For many farms the electricity or diesel bill is the most visible cost of irrigation, and the modernisation of irrigation districts towards pressurised networks has made that cost larger, not smaller. The FIGARO partners measured energy alongside water for that reason. This article explains where the energy goes and how much of it can be saved.
The physics in one line
A pump gives water energy in two forms: height and pressure. Engineers add them together as a single “head”, expressed in metres of water. Ten metres of head is almost exactly one bar of pressure. The energy needed is the weight of water multiplied by the head, divided by the efficiency of the pumping unit:
energy (kWh) = 9.81 × volume (m³) × head (m) ÷ (3,600 × efficiency)
Two rules of thumb follow directly from this formula, with no other assumption:
- lifting 1,000 m³ of water by one metre takes 2.7 kWh if nothing is lost;
- pressurising 1,000 m³ by one bar takes 27.8 kWh if nothing is lost.
Real pumping units lose energy in the motor, the pump itself and the valves around them. Divide by the overall efficiency to get what the meter actually records. At 60% efficiency, those 27.8 kWh per bar become about 46 kWh.
Where the head comes from
The total head a pump must deliver has three parts, and each one can be attacked separately.
| Component | What it is | What reduces it |
|---|---|---|
| Static lift | Height from the water level in the well, canal or reservoir to the field, plus the drawdown of a well while it pumps | Little, once the source is chosen; monitoring well levels avoids surprises |
| Operating pressure | Pressure needed at the emitter or sprinkler for it to work as designed | Choosing low-pressure emitters and nozzles, pressure-compensating drippers where the terrain varies |
| Friction losses | Energy lost as water rubs along pipes and through filters, valves and fittings | Larger pipes, clean filters, fewer restrictions, lower flow per line |
Operating pressure depends on the system and is printed in the manufacturer's data: drip emitters work at low pressure, impact sprinklers and big guns at much higher pressure. Friction rises steeply with velocity, roughly with the square of the flow in a given pipe. Running the same pipe at half the flow therefore cuts its friction loss by about three quarters.
A worked example
Take a drip-irrigated block that needs 3,000 m³ in a season (the FAO-56 method in our article on crop evapotranspiration is one way to estimate it). Suppose the water is drawn from a well 30 m deep and the system needs 2.5 bar at the head of the field, that is about 25 m. With 5 m of friction losses, the total head is 60 m.
- Ideal energy: 3,000 × 60 × 2.7 ÷ 1,000 ≈ 490 kWh.
- At 60% overall efficiency: about 820 kWh.
- At 45%, a figure an old or badly matched pump can reach: about 1,090 kWh.
The difference between the last two lines, roughly 270 kWh, comes from the pumping unit alone, without a single drop of water saved. These figures are our own calculation from the formula above, not field measurements. They show where to look before buying anything.
What measurements in Spain found
Spain modernised a large share of its irrigated area in the 2000s, replacing open canals and rotation schedules with pressurised, on-demand networks. Researchers at the University of Córdoba evaluated ten representative districts of this kind during the 2006–2007 season, using performance indicators from the International Program for Technology and Research in Irrigation and Drainage (IPTRID) and Spain's energy agency, the Instituto para la Diversificación y Ahorro de la Energía (IDAE). They reported (Rodríguez Díaz, Camacho Poyato and Blanco Pérez, 2011):
- an average of 2,589 m³ of water applied per hectare;
- about 1,000 kWh of energy per hectare to deliver it;
- an installed power of 1.56 kW per hectare;
- a pumping energy efficiency of 58%.
Dividing the two first figures gives roughly 0.39 kWh per cubic metre delivered, or 386 kWh per 1,000 m³. Applying the formula above with the 58% efficiency, that corresponds to an average head of a little over 80 m, the equivalent of about 8 bar. This is again our own calculation, but it is consistent with networks that both lift water and keep every hydrant under pressure. The authors concluded that the energy requirements of these schemes are high. The same water savings that justified modernisation had come with a new, recurring energy cost.
Where energy can be saved
- Match the pump to the duty. A pump has a best efficiency point. Oversized pumps throttled by a half-closed valve, or pumps that have worn over the years, can run far below it. A simple test of flow, pressure and electrical power shows the real efficiency, and is the cheapest audit a farm can do.
- Use variable speed where demand varies. A variable-frequency drive lets the motor slow down when fewer outlets are open. Pump physics (the affinity laws) say that power falls roughly with the cube of speed. A pump running at 80% speed needs only about half the power, though the head it can deliver falls too.
- Organise the network in sectors. In a shared network, the pump must satisfy the hydrant that needs the most head. Grouping outlets into sectors that irrigate at different times, so that high and low points do not run together, lets the station run at lower pressure. Energy use in shared pressurised networks was the subject of the talk on FIGARO's Picassent citrus pilot site given by Fernando Martínez of the Universitat Politècnica de València at the project's closing conference (listed on our presentations page).
- Fix uniformity before raising pressure. When the end of a lateral receives too little, the reflex is to raise the pressure or the run time for the whole field. Measuring and correcting drip irrigation uniformity addresses the cause instead.
- Shift pumping to cheaper hours. Where tariffs vary through the day, scheduling irrigation at night or around solar production changes the cost even if the kilowatt-hours stay the same. This is one of the advantages of a schedule calculated in advance, as the FIGARO platform did.
Water and energy together
Energy and water savings usually go together: every cubic metre not pumped is energy not spent. The exception is the switch from gravity to pressurised irrigation, which saves water at the field but adds pumping energy, as the Spanish districts show. The same trade-off appears at national scale: in the United States, farms spent $3.3 billion on energy for pumping irrigation water in 2023 (see our article on the 2023 US irrigation survey). FIGARO's field tests reported both water and energy savings for the platform; the detailed figures are in the deliverable on fresh water and energy savings listed on the project results page. For a farm, the practical lesson is to measure both: a water meter and an energy meter on the same pump, read on the same days, tell more than either one alone.
Sources
- Rodríguez Díaz J. A., Camacho Poyato E., Blanco Pérez M. (2011), “Evaluation of water and energy use in pressurized irrigation networks in Southern Spain”, Journal of Irrigation and Drainage Engineering 137(10): 644–650.
- FIGARO consortium, Deliverable D7.2, Quantification of fresh water and energy savings, 2016 (listed on our project results page).